Showing posts with label statistics. Show all posts

Thursday, 15 December 2016

Trump and white evangelical voters

I don't envy the choices that US citizens had during their recent presidential elections. Were I eligible I would not have wanted to vote for either of the main candidates, and even the Libertarian candidate does not seem that libertarian. In the lead up to the election and the aftermath there has been much analysis but I have not found it convincing. A  recent piece in the Atlantic by Merritt doesn't do much better.

One of the few things he gets correct is the appeal not to leave evangelicalism because of disillusionment over the election. There comes a time to leave groups but he is correct that this is not the time to be walking away from evangelicalism—not least because the US is smaller than the rest of the world.

But I want to challenge several of the assumptions here because the issue is a little more complicated than: lots of evangelicals voted for Trump.
81 percent of white evangelicals voted for the Trump ticket—a higher percentage than voted for George W. Bush, John McCain, or Mitt Romney.
A major premise of the article is that white evangelicals support Trump and in higher numbers than other Republican candidates of earlier elections. But did they? And what else explains their voting behaviour?

Using Merritt's source (which is exit polling data and will have a margin of error) we see that the numbers of white evangelicals for Republican and Democrat are

Percent white evangelicals voting for Republicans and Democrats
2004 R78% D21%
2008 R74% D24%
2012 R78% D21%
2016 R81% D16%

It is uncertain whether there is anything in such a small percentage change. It may well be within the margin of error. What it clearly does tell us is that historically evangelical whites have voted Republican and continued to do so this election consistent with historic trends.

But percentages do not tell us how many people voted, they tell us proportionally how people voted. If everyone voted the percentages would be helpful but not if the turnout is significantly different.

This election an estimated 133 million votes were cast* (55% of eligible voters), 129 million for Trump or Clinton. In 2012 129 million votes (55%). In 2008 131 million votes (58%). In 2004 122 million votes (57%).

Votes (millions)
2004 Bush 62 Kerry 59
2008 Obama 69 McCain 60
2012 Obama 66 Romney 61
2016 Trump 63 Clinton 66

But combining these tables is quite hard. We need to know how many white evangelicals actually voted. Pew tells us that the electorate is composed of 26% white evangelicals which is essentially unchanged since 2008. Do they mean by electorate voters or potential voters? If the later (which is what electorate usually means) that isn't definitive because potential voters are not actual voters and it could be that white evangelicals disproportionately vote (or don't vote) or didn't vote as much in a specific election. Either way, what we actually need to know is how many white evangelicals voted for Trump (or Clinton) and what that number is as a percentage of eligible white evangelical voters (each election), and has that changed over the last couple of decades.

Therefore we do not have definitive data to say that white evangelicals voted for Trump more enthusiastically than Republican candidates of yesteryear, nor can we say that the voting behaviour this year was significantly different based on reasonable inferences from data we do have. We see the same old same old, just as black females voted Democrat like they have done for the last several decades.

Which brings us to the second issue that Merritt fails to mention: Trump's rival. Merritt quotes several evangelicals who were unhappy with Trump as a candidate, to which I concur. (Ironically, that he can name so many examples kind of works against his argument). A large number of my conservative friends and colleagues disapproved of Trump. I have never heard more negative comments spoken by conservative Christians about a politician running on a conservative ticket. But one can't discuss Trump in isolation. He was running against Clinton. And a large number of conservatives have concerns about her also. They find her as dishonest as Trump if not more so. Interestingly—contra my comment about Trump above—only one of my liberal Christian friends denounced her. Now one need not necessarily vote for Trump for fear of a Clinton presidency, but it is an understandable position. Who did Merritt vote for? He did not say, though obviously not Trump. But Merritt's argument works both ways. If Christians want to wash their hands of evangelicalism because some voted Trump, cannot other Christians want to wash their hands of those who would vote for Clinton?


*Accurate numbers are hard to come by, this is a low estimate.

Sunday, 3 May 2015

Israelite census

God told Moses to number the men Israel when they came out from Egypt then again nearly 40 years later. The first a year after leaving Egypt, the second before they entered the promised land. The census of the 12 tribes included the 2 subtribes of Joseph: Ephraim and Manasseh. The 12 tribes were divided into 4 companies of 3 tribes, each headed by 1 of the 3 tribes. They camped on different sides of the tabernacle. Levi was not included as they were set apart for service to God. They were counted separately and camped around the tabernacle.

The first census was in the 2nd year after leaving Egypt (Numbers 1). The census data is repeated in Numbers 2 with the division totals. The tribe of Levi is documented in Numbers 3. The second census was in the 40th year after leaving Egypt (Numbers 26).

All males aged 20 and over were counted for the nation census. All males aged 1 month and over were counted for the Levite census.

Israel had grown rapidly from ~70 males a little over 200 years earlier. Because of their unfaithfulness in refusing to fight the Canaanites they died in the desert. A similar number of men over the age of 20 (but none over 60) were alive ~40 years later. While every Israelite over the age of 20 died in the desert (Numbers 14), this may not have included the Levites. There was no spy sent from the tribe of Levi (Numbers 13), Levi had previously been zealous for the Lord (Exodus 32), and the Levite Eleazer (Exodus 6:25) entered Canaan (Joshua 17:4). Caleb and Joshua were also excluded from the punishment (Numbers 14:30).

Here are the numbers for the 2 censuses. The number of Levites does not add up; the sum of the 3 clans is 22,300 but the total given is 22,000. It is likely that the total is correct thus there is probably a transcription error for Gershon or Kohath.

Company Tribe Clan Census 1
Census 2
Numbers 1-3 Numbers 26
Reuben Reuben
46500
43730
South Simeon
59300
22200

Gad
45650
40500


151450
Judah Judah
74600
76500
East Issachar
54400
64300

Zebulun
57400
60500


186400
Ephraim Ephraim
40500
32500
West Manasseh
32200
52700

Benjamin
35400
45600


108100
Dan Dan
62700
64400
North Asher
41500
53400

Naphtali
53400
45400


157600

Total
603550
601730

Levi


Gershon 7500


Kohath 8600


Merari 6200


22000 (22300) 23000

Friday, 14 March 2014

Bible reading time

Desiring God Ministries has created a graph of reading times for each book of the Bible. It is useful in that it takes account of varying length of the chapters. I am uncertain of their method. I suspect it takes genre into account as well, Jeremiah has about the same number of words as the Psalms, though poetry is read slower than prose.


Sunday, 26 August 2012

Bible statistics

Updated.

Included is the number of books, chapters, verses and words in the Bible. These are based on the English Standard Version (ESV) 2007 version, main text. Footnotes, chapter numbers, verse numbers, and book names are excluded. Psalm introductions are included. Word count is via LibreOffice. A brief manual check suggests this is more accurate than the OpenOffice word count I used previously. Verse count is from Biblegateway.com looking at the final verse number for each chapter. It will be incorrect for chapters that miss verses*. Verse data is cross checked on this data and this data. I diverge from the former slightly which uses a Catholic translation, I am concordant with the latter excepting the Psalm title count.

I realise chapters and verses are artificial constructs. Chapters were inserted into the Bible circa 1228 by Stephen Langton. The Old Testament was possibly divided into verses by Isaac Nathan circa 1448 and the New Testament by Robert Stephanus in 1551.

Book Chapters Verses Words
Old Testament
Genesis 50 1533 36321
Exodus 40 1213 30881
Leviticus 27 859 23431
Numbers 36 1288 30950
Deuteronomy 34 959 27528
Joshua 24 658 17935
Judges 21 618 18281
Ruth 4 85 2425
1 Samuel 31 810 24118
2 Samuel 24 695 19734
1 Kings 22 816 23415
2 Kings 25 719 22760
1 Chronicles 29 942 18522
2 Chronicles 36 822 24779
Ezra 10 280 6889
Nehemiah 13 406 9842
Esther 10 167 5478
Job 42 1070 17603
Psalms 150 2577 42284
Proverbs 31 915 14530
Ecclesiastes 12 222 5333
Song of Solomon 8 117 2533
Isaiah 66 1292 35244
Jeremiah 52 1364 40432
Lamentations 5 154 3251
Ezekiel 48 1273 37184
Daniel 12 357 11224
Hosea 14 197 4964
Joel 3 73 1895
Amos 9 146 4047
Obadiah 1 21 604
Jonah 4 48 1298
Micah 7 105 3000
Nahum 3 47 1111
Habakkuk 3 56 1356
Zephaniah 3 53 1556
Haggai 2 38 1083
Zechariah 14 211 6050
Malachi 4 55 1738
OT Total 929 23261 581609
New Testament
Matthew 28 1071 22640
Mark 16 678 14344
Luke 24 1151 24605
John 21 879 18882
Acts 28 1007 23464
Romans 16 433 9467
1 Corinthians 16 437 9268
2 Corinthians 13 257 6050
Galatians 6 149 3102
Ephesians 6 155 3010
Philippians 4 104 2144
Colossians 4 95 1934
1 Thessalonians 5 89 1841
2 Thessalonians 3 47 1065
1 Timothy 6 113 2315
2 Timothy 4 83 1631
Titus 3 46 926
Philemon 1 25 457
Hebrews 13 303 6903
James 5 108 2317
1 Peter 5 105 2389
2 Peter 3 61 1550
1 John 5 105 2490
2 John 1 13 298
3 John 1 15 303
Jude 1 25 604
Revelation 22 404 11450
NT Total 260 7958 175449
Bible
Grand total 1189 31219 757058

This information may be more useful if derived from the Hebrew Old Testament and Greek New Testament texts, though there would still be disagreement over which texttype or critical text to use. The Greek New Testament has ~138000 words.

If I have my calculations correct the number of words in the ESV Bible is 757058 excluding book titles and 757143 including them.

* Such as Matthew 12:47; Matthew 17:21; Matthew 18:11; Matthew 23:14; Mark 7:16; Mark 9:44; Mark 9:46; Mark 11:26; Mark 15:28; Luke 17:36; Luke 23:17; Luke 24:40; John 5:4; Acts 8:37; Acts 15:34; Acts 24:7; Acts 28:29; Romans 16:24.

Saturday, 28 April 2012

Quiz stumper

I found this amusing


Though I think the question would be even better formulated thus:

If you choose an answer this question at random, what is the chance you will be correct?
  1. 0%
  2. 25%
  3. 25%
  4. 50%

Sunday, 15 January 2012

Number of Christians by country

Interesting article from PewResearch. They give the number of Christians per country from 2010. I have a quibble about how they define Christian, thus the West may be over estimated as well as the number of Catholics in South America. The number in China is probably a little low. I don't think they should include groups that deny the deity of Christ, though this will not affect the numbers considerably.

The top 30 are

Country, Estimated Christian Population

United States 246,790,000
Brazil 175,770,000
Mexico 107,780,000
Russia 105,220,000
Philippines 86,790,000
Nigeria 80,510,000
China 67,070,000
Congo 63,150,000
Germany 58,240,000
Ethiopia 52,580,000
Italy 51,550,000
United Kingdom 45,030,000
Colombia 42,810,000
South Africa 40,560,000
France 39,560,000
Ukraine 38,080,000
Spain 36,240,000
Poland 36,090,000
Argentina 34,420,000
Kenya 34,340,000
India 31,850,000
Uganda 28,970,000
Peru 27,800,000
Tanzania 26,740,000
Venezuela 25,890,000
Canada 23,430,000
Romania 21,380,000
Indonesia 21,160,000
Ghana 18,260,000
Angola 16,820,000

Saturday, 23 July 2011

Public health and unwarranted conclusions

I read a fair number of articles. This is a paraphrase of one but I have seen similar several times over.
In conclusion our results show that exposure X is associated with significantly increased chance of outcome Y. Public health recommendations/ government agencies should reduce/ ban exposure X.
(This is assuming outcome Y is bad, a converse argument could be made if exposure X is thought to be good.)

This is frustrating for several reasons.

1. The word significantly usually means statistically significant. That is the authors are confident that the association they have found is a real one, not a chance one. For various reasons I think many findings that are claimed to be real are actually chance, so I may not be convinced the statistics justify the conclusion. But assuming the statistics do justify it, the significance relates to the degree of confidence in the result, not the size of the result. The phrasing "significantly increased chance" sounds like the size of the association is strong. It may be minor. A risk ratio of 1.003 (1.002–1.004, p <0.001) is statistically very significant but not functionally significant. Even a risk ratio of 3 (i.e. you are 3 times more likely to develop outcome Y) may be irrelevant if the outcome is extremely rare. Does it really matter if you increase your risk from 1 in a million to 3 in a million?

2. Association is not causation. Yes it may be a real effect, and it may be a relevant one, but it still may just be an association. We need to establish causation. Addressing a problem if it is causative may not resolve it. Addressing an association that is not causative definitely will not resolve it. And it could potentially worsen it. We need studies that show definite causation. Then we need studies that show intervention to reduce exposure X actually reduces outcome Y.

3. Nothing in the research relates to public policy. The study does not show that the policy was enacted and was effective. Even convincing knowledge that reducing outcome Y by preventing public exposure to X does not imply anything should be done by the state about X. Should the state ban hang-gliding because it is associated with increased mortality? Should it make every vice illegal because of detrimental effects on self? And there are further question about enforcing a ban. What about the monetary cost considerations? What about liberty? Will the unintended consequences be worse than the problem? Perhaps all that is warranted is education. For example the government can mandate labelling without banning a substance.

I am not arguing against any public policy. It just seems that socialism is so embedded in some people's psyche that new information to them logically implies government intervention.

Wednesday, 24 November 2010

Computer software deciphers Ugaritic

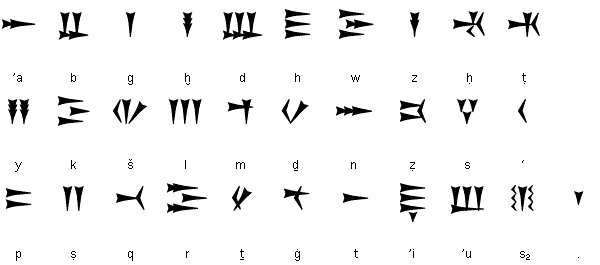
Programmers have used statistical techniques to correlate Ugaritic and Hebrew alphabets as well as forms of words which they assume are somewhat parallel in related languages in order to decipher Ugaritic.
To duplicate the “intuition” that Robinson believed would elude computers, the researchers’ software makes several assumptions. The first is that the language being deciphered is closely related to some other language: In the case of Ugaritic, the researchers chose Hebrew. The next is that there’s a systematic way to map the alphabet of one language on to the alphabet of the other, and that correlated symbols will occur with similar frequencies in the two languages.

The system makes a similar assumption at the level of the word: The languages should have at least some cognates, or words with shared roots, like main and mano in French and Spanish, or homme and hombre. And finally, the system assumes a similar mapping for parts of words. A word like “overloading,” for instance, has both a prefix — “over” — and a suffix — “ing.” The system would anticipate that other words in the language will feature the prefix “over” or the suffix “ing” or both, and that a cognate of “overloading” in another language — say, “surchargeant” in French — would have a similar three-part structure.

The system plays these different levels of correspondence off of each other. It might begin, for instance, with a few competing hypotheses for alphabetical mappings, based entirely on symbol frequency — mapping symbols that occur frequently in one language onto those that occur frequently in the other. Using a type of probabilistic modeling common in artificial-intelligence research, it would then determine which of those mappings seems to have identified a set of consistent suffixes and prefixes. On that basis, it could look for correspondences at the level of the word, and those, in turn, could help it refine its alphabetical mapping. “We iterate through the data hundreds of times, thousands of times,” says Snyder, “and each time, our guesses have higher probability, because we’re actually coming closer to a solution where we get more consistency.” Finally, the system arrives at a point where altering its mappings no longer improves consistency.
Ugaritic was treated as unknown and the resultant translation turned out to be reasonably accurate.

This is beneficial for languages that are related, that is both are derived from a common source. It does not seem to be of use if we discovered a language unrelated to any known ones (unlikely). But it could help with increasing deciphering speed in poorly characterised languages.
“Each language has its own challenges,” Barzilay agrees. “Most likely, a successful decipherment would require one to adjust the method for the peculiarities of a language.” But, she points out, the decipherment of Ugaritic took years and relied on some happy coincidences — such as the discovery of an axe that had the word “axe” written on it in Ugaritic. “The output of our system would have made the process orders of magnitude shorter,” she says.

Indeed, Snyder and Barzilay don’t suppose that a system like the one they designed with Knight would ever replace human decipherers. “But it is a powerful tool that can aid the human decipherment process,” Barzilay says. Moreover, a variation of it could also help expand the versatility of translation software. 

Tuesday, 8 December 2009

Adjusting multi-site and single site temperature data

NIWA offer as their explanation for the temperature adjustments the paper
  • Rhoades, D.A. and Salinger, M.J., 1993: Adjustment of temperature and rainfall measurements for site changes. International Journal of Climatology 13, 899–913.
Though they do not link to it nor give a digital object identifier (doi:10.1002/joc.3370130807).

The abstract states
Methods are presented for estimating the effect of known site changes on temperature and rainfall measurements. Parallel cumulative sums of seasonally adjusted series from neighbouring stations are a useful exploratory tool for recognizing site-change effects at a station that has a number of near neighbours. For temperature data, a site-change effect can be estimated by a difference between the target station and weighted mean of neighbouring stations, comparing equal periods before and after the site change. For rainfall the method is similar, except for a logarithmic transformation. Examples are given. In the case of isolated stations, the estimation is necessarily more subjective, but a variety of graphical and analytical techniques are useful aids for deciding how to adjust for a site change. (Emphasis added)
I did not fully follow all the maths in the paper. It was not particularly complex but I would need to spend some time doing examples to completely grasp it.

In the introduction they define "site change",
We use the term site change to mean any sudden change of non-meteorological origin. Gradual changes can seldom be assigned with any certainty to non-meteorological causes. Where long-term homogeneous series are required, for example, for studies of climate change, it is best to choose stations that are unlikely to have been affected by gradual changes in shading or urbanization. This is no easy task. Karl et al. (1988) have concluded that urban effects on temperature are detectable even for small towns with a population under 10000.

...This paper is concerned with the estimation of site-change effects when the times of changes are known a priori, such as when the station was moved or the instrument replaced.
The paper predominantly discusses adjustments to data when there are site changes and there are surrounding overlapping data sets (nearby thermometers) that can be used to assess whether there needs to be adjustment.

Later in the paper when discussing sites that have no overlapping data the authors state,
Such an adjustment involves much greater uncertainty than the adjustment of a station with many neighbours. A greater degree of subjectivity is inevitable. In the absence of corroborating data there is no way of knowing whether an apparent shift that coincides with a site change is due to the site change or not. However, several statistical procedures can be used alongside information on station histories to assist in the estimation of the effect of a site change. These include graphical examination of the data, simple statistical tests for detecting shifts applied to intervals of different length before and after the site change, and identification of the most prominent change points in the series independently of known site changes. Finally, a subjective judgement must be made whether to adjust the data or not, taking into account the consistency of all the graphical and analytical evidence supporting the need for an adjustment and any other relevant information.
Moreover when they apply this adjustment to a station in Christchurch to demonstrate their method comparing with the more accurate method used earlier in the paper they significantly over estimate the difference,
The 1975 site change at Christchurch Airport is somewhat overestimated, when compared with the neighbouring stations analysis. The contrast between the estimates based on 2 years data before and after this site change is particularly marked. For the neighbouring stations analysis the estimate is 0.45°C (Table TI); for the isolated station analysis the estimate is 1.58°C (Table V). This is to be expected when a site change coincides with an actual shift in temperature, as occurred in this case. The isolated station analysis then estimates the sum of the site change effect and the actual shift.
In their conclusion they note,
Adjustments for site changes can probably never be done once and for all. For stations with several neighbours, the decision to adjust for a site change usually can be taken with some confidence. The same cannot be said for isolated stations. However, large shifts can be recognized and corrected, albeit with some uncertainty. Ideally, for isolated stations, tests for site change effects would be incorporated into the estimation of long-term trends and periodicities as suggested by Ansley and Kohn (1989). This is not practicable at present on a routine basis, but may be in the future.
And
Whatever adjustment procedures are used, the presence of site changes causes an accumulating uncertainty when comparing observation that are more distant in time. The cumulative uncertainties associated with site change effects, whether adjustments are made or not, are often large compared with effects appearing in studies of long-term climate change. For this reason it is a good idea to publish the standard errors of site change effects along with homogenized records, whether adjustments are made or not. This would help ensure that, in subsequent analyses, not too much reliance is placed on the record of any one station. (Emphasis added)
Ironically, the methods suggested in this paper do not include the method used by NIWA in defending their Wellington data.

Friday, 27 November 2009

NIWA defends it adjustment of data

NIWA have released a statement that the data that shows a warming trend in New Zealand over 100 years was adjusted.
NIWA’s analysis of measured temperatures uses internationally accepted techniques, including making adjustments for changes such as movement of measurement sites.
Though the paper (and my post yesterday) suggest adjustment was the likely explanation. However the graph and the surrounding paragraph fail to mention the data is adjusted. I read significant numbers of scientific papers and they are always referencing the raw and the adjusted data labelling both. There are statistical issues with some of these papers but this is not one of them.

NIWA go on to say,
Such site differences are significant and must be accounted for when analysing long-term changes in temperature. The Climate Science Coalition has not done this.

NIWA climate scientists have previously explained to members of the Coalition why such corrections must be made. NIWA’s Chief Climate Scientist, Dr David Wratt, says he’s very disappointed that the Coalition continue to ignore such advice and therefore to present misleading analyses.
Unfortunately this comment fails to identify and thus address the issue which is: "why" is not the question the Coaliltion is asking; it is "what" and "how". What is the adjustment? and how have you done it? Treadgold (an author of the paper) writes,
We cannot account for adjustments, because we don’t know what they are. We ask only to know the adjustments that have been made, in detail, for all seven stations, and why.
Transparency demands that the specific reasons for data adjustment be given.
  • What stations have been adjusted?
  • When were they adjusted?
  • Is the adjustment stepwise or a trend?
  • Is there overlap of data when stations are shifted?
  • Does the overlapped data show good correlation?
  • Have adjustments been modified in subsequent years? Why?
  • What is the computer code that applies the adjustment?
This sort of information allows others to review the legitimacy of such decisions. And various groups can argue for and against these reasons and the weighing various reasons should be given.

Why the secrecy? The refusal to be open with data and theories is looked upon with suspicion, and rightly so.

Gareth Renowden writes a post explaining why adjustments are made to the data. The excessive rhetoric notwithstanding, the argument is plausible. But it still leaves questions unanswered. While the Wellington station may just be used an example, what of the other 6 stations? Wellington may show a rise after adjustment, but this will be diluted when averaged across all the station unless they all showed a rise. It they did what is the explanation for them.

Though I am not fully convinced with NIWA's explanation. The Airport and Kelburn temperatures seem well correlated, with Kelburn cooler being at a higher altitude. And Thorndon and Airport are both at the same elevation (sea level). But there is no correlation established between Thorndon and the other 2 locations.


Elevation is not the sole determiner of temperature. There may be other considerations that make Thorndon and the Airport different temperatures. If so, then the adjustment down of the Thorndon data may be excessive. It should be easy to set up further measurements at Thorndon currently and see how they correlate to Kelburn and the Airport. If they all correlate well then we can establish a more accurate correction factor for the pre-1930 Thorndon data.

Thursday, 26 November 2009

New Zealand not warming?

It seems to residents that the country has not being getting warmer over the last decade. Such that advocates of global warming prefer the term climate change so that any weather anomaly can be attributed to anthropomorphic global warming. And people are willing to parrot claims that some parts of the world will get colder (this may be a prediction of the theory but should encourage one to cautiously consider these claims).

The New Zealand National Institute of Atmosphere and Water Research (NIWA) do not show significant change since 2000 but they do show an increase over the last century as seen in this graph.

Graph. Mean annual temperature over New Zealand, from 1853 to 2008 inclusive, based on between 2 (from 1853) and 7 (from 1908) long-term station records. The blue and red bars show annual differences from the 1971 - 2000 average, the solid black line is a smoothed time series, and the dotted line is the linear trend over 1909 to 2008 (0.92°C/100 years).

Yesterday the New Zealand Climate Science Coalition released an article challenging this rise using NIWA's own data. They plotted the temperatures from the NIWA source data and got this graph.

Whereas the first shows a rise of ~1°C per century, the second shows no discernable rise. The difference between the 2 graphs? The second uses raw data, the first (probably) has adjusted the data.
About half the adjustments actually created a warming trend where none existed; the other half greatly exaggerated existing warming.
There are legitimate reasons why data can and should be adjusted. Cities grow and hence warm so later temperatures may be warmer, especially overnight. Different thermometers may be used that show a consistent measurable difference. But there are 2 comments to make about adjusting data. Firstly adjusted data should be labelled as such with the unadjusted data displayed alongside it and the factors the data was adjusted for.

Secondly, it makes a difference whether adjusting data removes or produces an association. Frequently differences in data are seen because they attributes of the data sets are different. If we compare test scores between highschools to create a league table it may be reasonable to correct for number of children in different grades as some schools may have more students at higher levels, or one school may only let its brightest children sit the test. But we should be more cautious about accepting an association that only appears after adjustment. It is not that there can be no difference, rather it is that enough statistical manipulation can show a difference and the reasons for the adjusted variables are then argued after the fact.

If you do find a difference after adjustment you need to check your adjustment factors are not associated with the variable that is under consideration, in this case you cannot adjust for time as time changes are what is being looked for; and you must validate your adjustment with an independent data set.

On top of the release of emails and computer code from the now infamous Climate Research Unit at the University of East Anglia, UK; perhaps there might be some room for debate around the issues of climate change. Is it happening? Are humans responsible? Would it be detrimental? Should we pay attention to scientists who refuse to reveal their data and formulae?

Saturday, 10 October 2009

Adjusting multiple choice examinations

Multiple choice examinations have several benefits. They have no intra- or intermarker variability. In fact they can be automated. And I wouldn't be surprised if they are as effective as any other system in effectively evaluating material.

They need to be well written.
  • The correct answer needs to be clearly more correct than other options.
  • The correct answer should not be able to be guessed by the construction of the question.
  • The order of the answer option should be random.
  • A reasonable number of options need to be given.
    • And the same number of options for every question.
  • A significant number of questions needs to be included.
    • The problem with multiple choice questions is the chance element. This can be reduced by increasing the number of questions.
If we have 20 questions with 4 options for each question, then random guessing will lead to people getting 5 correct on average (Exam mark = 25%); 20 / 4. However the range of correct answers will be quite great. Some will get 1 correct (5%), others 10 (50%). Whereas 200 questions will mean that people get 50 correct on average (Exam mark still = 25%), but a much lower range. Some may get 40 correct (20%), others 60 correct (30%).

Thus both exams when taken by people ignorant of the topic will give an average mark of 25%, but the chance of any particular individual getting a high mark is much greater with a smaller number of questions.

This seems obvious based on the examples above. Mathematically the range of marks is (inversely) related to the number of questions. The standard deviation of the range of answer marks is inversely proportional to the square root of the number of questions.

The other issue is standardising the results. Because people are likely to get 25% of the answers correct by chance (for 4 options), then one could subtract 25% from the final mark. So if you get 25% as a raw mark, you likely didn't know the answer to any of the questions, that is your knowledge is 0%. So we subtract 25% from your mark to get your adjusted mark, which is 0%.

However if you get 100%, it is unlikely you knew 75% and got the other 25% correct by chance. Rather you get the ones you know correct, and you tend to get about a quarter of the ones you don't know correct. So if you know 50% of the questions you will get 50% plus a quarter of the remaining 50%, that is 12.5%, which gives you a total of 50% + 12.5% = 62.5%. So a raw mark of 62.5% needs to be scaled back to 50%. And 100% means you know all the answers and does not need to be scaled back at all.

So we need to adjust the raw marks linearly to get adjusted marks.
  • Let N be the number of questions.
  • Let R be the number of options.
  • Let X be the number of questions correct.
  • Let Y be the adjusted number of questions correct.
Then
  • X/N is the raw mark.
  • Y/N is the adjusted mark.
  • N/R is the chance number of correct answers.
When X = N/R then the mark needs to be adjusted to zero, ie. Y = 0.
When X = N then the mark needs no adjustment, ie. Y = N and Y/N = 1 (= 100%).

The number of questions correct equals the number of questions known plus the remaining number of questions divided by the number of options.

X = Y + (NY)/R

Rearranging for Y we get

Y = (RXN)/(R – 1)

Or as a mark

Y/N = 100% × (RXN)/N(R – 1)

And any negative numbers are given zero.

Thursday, 26 March 2009

Bible statistics

See updated post here.

Number of books, chapters, verses and words in the Bible. These are based on the English Standard Version (ESV) 2007 version, main text. I haven't been able to find the ESV summary data on the internet. The ESV exists in database form in various places so the information should be easy to calculate, I just don't have the facilities. Word count was done in Open Office. I will repost this if I get the verse data.

Footnotes, chapter and verse numbers, book names are excluded. Psalm titles are included. I realise the chapters and verses are an artificial construct.

Chapters were inserted into the Bible circa 1228 by Stephen Langton.

The Old Testament was possibly divided into verses by Isaac Nathan circa 1448 and the New Testament by Robert Stephanus in 1551.

Book Chapters Verses Words
Old Testament
Genesis 50
36909
Exodus 40
31271
Leviticus 27
23602
Numbers 36
31211
Deuteronomy 34
27845
Joshua 24
18060
Judges 21
18556
Ruth 4
2475
1 Samuel 31
24536
2 Samuel 24
20074
1 Kings 22
23741
2 Kings 25
23088
1 Chronicles 29
18590
2 Chronicles 36
24938
Ezra 10
6915
Nehemiah 13
9902
Esther 10
5519
Job 42
17825
Psalms 150
42420
Proverbs 31
14566
Ecclesiastes 12
5344
Song of Solomon 8
2537
Isaiah 66
35555
Jeremiah 52
40975
Lamentations 5
3286
Ezekiel 48
37524
Daniel 12
11314
Hosea 14
4997
Joel 3
1913
Amos 9
4134
Obadiah 1
606
Jonah 4
1318
Micah 7
3012
Nahum 3
1114
Habakkuk 3
1366
Zephaniah 3
1574
Haggai 2
1096
Zechariah 14
6145
Malachi 4
1769
OT Total 929
587622
New Testament
Matthew 28
23137
Mark 16
14642
Luke 24
25104
John 21
19322
Acts 28
23744
Romans 16
9534
1 Corinthians 16
9316
2 Corinthians 13
6061
Galatians 6
3116
Ephesians 6
3017
Philippians 4
2144
Colossians 4
1936
1 Thessalonians 5
1842
2 Thessalonians 3
1065
1 Timothy 6
2318
2 Timothy 4
1633
Titus 3
927
Philemon 1
457
Hebrews 13
6953
James 5
2333
1 Peter 5
2397
2 Peter 3
1553
1 John 5
2492
2 John 1
298
3 John 1
303
Jude 1
607
Revelation 22
11559
NT Total 260
177810
Bible
Grand total 1189
765432


This information may be more useful for the Hebrew and Greek text though there would still be disagreement over which texttype or critical text to use.

Greek New Testament ~138000 words.

If I have my calculations correct the number of words in the ESV Bible is 765432 if the book titles are excluded, and 765517 words if they are included.

Labels

abortion (8) absurdity (1) abuse (1) accountability (2) accusation (1) adultery (1) advice (1) afterlife (6) aid (3) alcohol (1) alphabet (2) analogy (5) analysis (1) anatomy (1) angels (1) animals (10) apologetics (47) apostasy (4) apostles (1) archaeology (23) architecture (1) Ark (1) Assyriology (12) astronomy (5) atheism (14) audio (1) authority (4) authorship (12) aviation (1) Babel (1) baptism (1) beauty (1) behaviour (4) bias (6) Bible (41) biography (4) biology (5) bitterness (1) blasphemy (2) blogging (12) blood (3) books (2) brain (1) browser (1) bureaucracy (3) business (5) calendar (7) cannibalism (2) capitalism (3) carnivory (2) cartography (1) censorship (1) census (2) character (2) charities (1) children (14) Christmas (4) Christology (8) chronology (54) church (4) civility (2) clarity (5) Classics (2) classification (1) climate change (39) coercion (1) community (3) conscience (1) contentment (1) context (2) conversion (3) copyright (5) covenant (1) coveting (1) creation (5) creationism (39) criminals (8) critique (2) crucifixion (14) Crusades (1) culture (4) currency (1) death (5) debate (2) deception (2) definition (16) deluge (9) demons (3) depravity (6) design (9) determinism (27) discernment (4) disciple (1) discipline (2) discrepancies (3) divinity (1) divorce (1) doctrine (4) duty (3) Easter (11) ecology (3) economics (28) education (10) efficiency (2) Egyptology (10) elect (2) emotion (2) enemy (1) energy (6) environment (4) epistles (2) eschatology (6) ethics (36) ethnicity (5) Eucharist (1) eulogy (1) evangelism (2) evil (9) evolution (13) examination (1) exegesis (22) Exodus (1) faith (22) faithfulness (1) fame (1) family (5) fatherhood (2) feminism (1) food (3) foreknowledge (4) forgiveness (4) formatting (2) fraud (1) freewill (29) fruitfulness (1) gematria (4) gender (5) genealogy (11) genetics (6) geography (3) geology (2) globalism (2) glory (6) goodness (3) gospel (4) government (18) grace (9) gratitude (2) Greek (4) happiness (2) healing (1) health (7) heaven (1) Hebrew (4) hell (2) hermeneutics (4) history (24) hoax (5) holiday (5) holiness (5) Holy Spirit (3) honour (1) housing (1) humour (36) hypocrisy (1) ice-age (2) idolatry (4) ignorance (1) image (1) inbox (2) inerrancy (17) infinity (1) information (11) infrastructure (2) insight (2) inspiration (1) integrity (1) intelligence (4) interests (1) internet (3) interpretation (87) interview (1) Islam (4) judgment (20) justice (25) karma (1) kingdom of God (12) kings (1) knowledge (15) language (3) lapsology (7) law (21) leadership (2) libertarianism (12) life (3) linguistics (13) literacy (2) literature (21) logic (33) love (3) lyrics (9) manuscripts (12) marriage (21) martyrdom (2) mathematics (10) matter (4) measurement (1) media (3) medicine (11) memes (1) mercy (4) Messiah (6) miracles (4) mission (1) monotheism (2) moon (1) murder (5) names (1) nativity (7) natural disaster (1) naval (1) numeracy (1) oceanography (1) offence (1) orthodoxy (3) orthopraxy (4) outline (1) paganism (2) palaeontology (4) paleography (1) parable (1) parenting (2) Passover (2) patience (1) peer review (1) peeves (1) perfectionism (2) persecution (2) perseverance (1) pharaohs (5) philanthropy (1) philosophy (34) photography (2) physics (18) physiology (1) plants (3) poetry (2) poison (1) policing (1) politics (31) poverty (9) prayer (2) pride (2) priest (3) priesthood (2) prison (2) privacy (1) productivity (2) progress (1) property (1) prophecy (7) proverb (1) providence (1) quiz (8) quotes (637) rebellion (1) redemption (1) reformation (1) religion (2) repentance (1) requests (1) research (1) resentment (1) resurrection (5) revelation (1) review (4) revival (1) revolution (1) rewards (2) rhetoric (4) sacrifice (4) salt (1) salvation (30) science (44) self-interest (1) selfishness (1) sermon (1) sexuality (20) shame (1) sin (16) sincerity (1) slander (1) slavery (5) socialism (4) sodomy (1) software (4) solar (1) song (2) sovereignty (15) space (1) sport (1) standards (6) statistics (13) stewardship (5) sublime (1) submission (5) subsistence (1) suffering (5) sun (1) survey (1) symbolism (1) tax (3) technology (12) temple (1) testimony (5) theft (2) toledoth (2) trade (3) traffic (1) tragedy (1) translation (19) transport (1) Trinity (2) truth (27) typing (1) typography (1) vegetarianism (2) vice (2) video (10) virtue (1) warfare (7) water (2) wealth (9) weird (6) willpower (4) wisdom (4) witness (1) work (10) worldview (4)